General board:
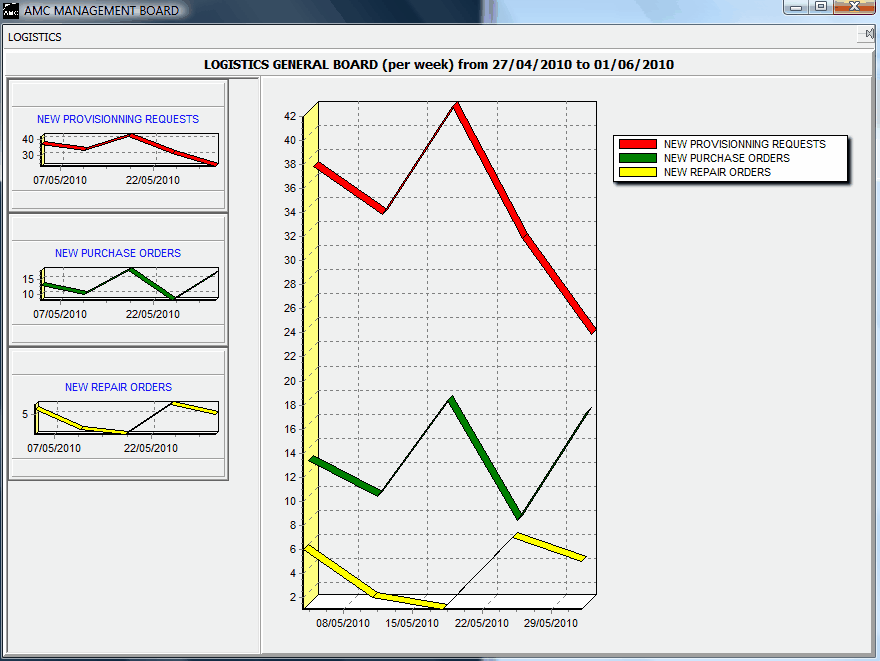
This logistics general board displays the global logistics trends over a user defined period. The available graphical functions are listed on the left side and can be added or removed to/from the main chart (located on the right side) by a simple left click. On the above example, the total number of provisioning requests (in red) is compared to the number of purchase orders (green) and repair orders (yellow). This charts is used to analyze the global efficiency of the logistic department and isolate the department functions which may have difficulties to keep-up:
- a relatively low number of purchase / repair orders compared to the total number of provisioning requests indicates a good quantity and definition of the stored materials (much requests are handled directly using stored materials)
- a drift of the purchase / repair orders trends compared to the provisioning request may indicate a late processing of provisioning requests by the logistics department.
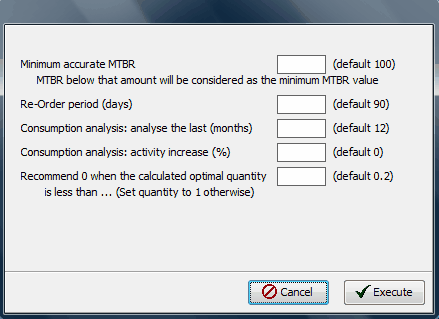
Stock level analysis
This utility computes the minimum quantity of each material based on customer's defined criteria (see below) and compares these quantities to the quantities available on the shelves.
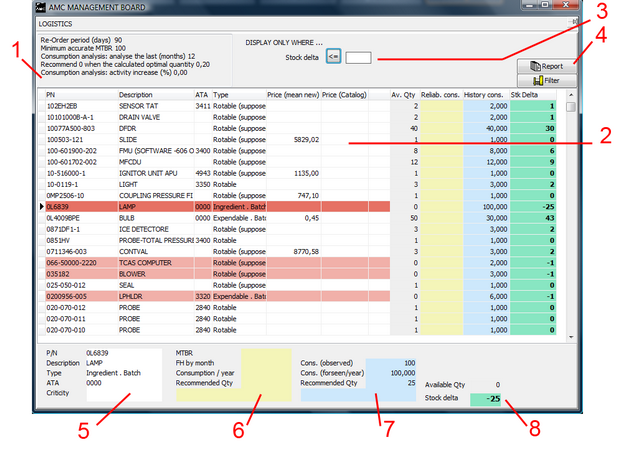
1- Recalls the assumptions used to calculate the recommended material quantities
2- This table presents all computed materials with the associated quantities available in stock and the recommend quantities
3- Show / hide the materials having stock delta (quantity in stock - recommended quantity) >= or <= to a specified quantity
4- Print the analysis report (or record as pdf file)
5- General data of the material currently selected in the grid (2): P/N, description, type
6- Reliability data of the material currently selected in the grid (2) and resulting recommended quantity
7- Observed consumption of the material currently selected in the grid (2) and resulting recommended quantity
8- Available quantity and total recommended quantity (based on reliability data or the observed consumption, whichever is the highest)
Material costs analysis
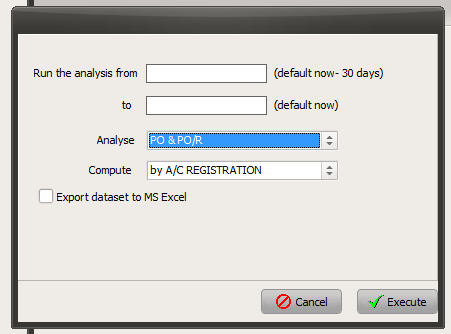
Specify the period to be computed in the above screen and press the "Execute" button
The purchase costs per aircraft are then displayed as per the following example:
--------------------------
Purchase Orders / Aircraft From 01/01/2010 to 01/06/2010
All costs are specified in constant base currency (EUR)
Registr. AC Type P/O amount PO/R amount Total FH EUR/FH Delta (T-1)
none none 18 890 68 857 - N/A -6,94%
F-AAMS A320 17 785 3 302 244 85,57 -35,36%
F-BAMS A320 37 708 0 518 71,59 -5,58%
F-CAMS A320 44 429 0 331 133,81 +38,64%
F-DAMS A320 30 051 0 345 88,43 +55,28%
F-EAMS A330-300 223 331 1 189 785 286,89 -23,04%
--------------------------
The last column "Delta (T-1)" is the variation of purchase costs compared to the previous period (the previous period being the one preceding immediately the analyzed period and having the same duration). This variation is calculated on the Cost/FH value when this value exists (Total FH is non zero and non N/A) and on the total cost otherwise.
The first row represent the costs which are not associated with any aircraft (stock replenishment orders)